Uplift modeling is a technique used to estimate the incremental impact of a treatment or intervention on an outcome, often used in marketing. It helps identify which individuals are more likely to respond positively to a treatment, allowing for more targeted interventions.
To me this is basically conditional average treatment effect (CATE).
I am copying this code from https://github.com/uber/causalml/blob/master/docs/examples/uplift_trees_with_synthetic_data.ipynb. Just to see how it works and also test out python code in quarto.
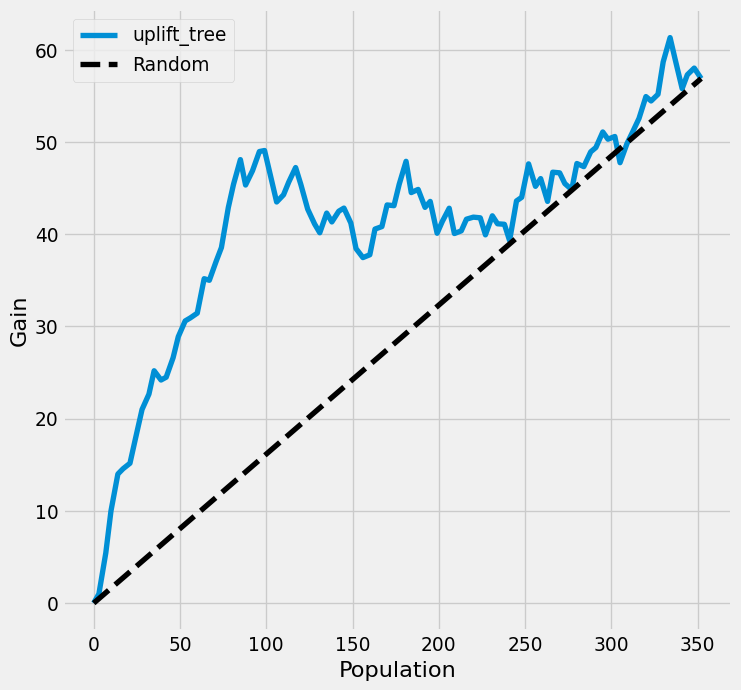
import numpy as npimport pandas as pdfrom causalml.dataset import make_uplift_classificationfrom causalml.inference.tree import UpliftRandomForestClassifierfrom causalml.metrics import plot_gainfrom sklearn.model_selection import train_test_splitimport importlibprint(importlib.metadata.version('causalml') )df, x_names = make_uplift_classification()df.head()# Look at the conversion rate and sample size in each groupdf.pivot_table(values='conversion', index='treatment_group_key', aggfunc=[np.mean, np.size], margins=True)# Split data to training and testing samples for model validation (next section)df_train, df_test = train_test_split(df, test_size=0.2, random_state=111) from causalml.inference.tree import UpliftTreeClassifierclf = UpliftTreeClassifier(control_name='control')clf.fit(df_train[x_names].values, treatment=df_train['treatment_group_key'].values, y=df_train['conversion'].values)p = clf.predict(df_test[x_names].values)df_res = pd.DataFrame(p, columns=clf.classes_)df_res.head()uplift_model = UpliftRandomForestClassifier(control_name='control')uplift_model.fit(df_train[x_names].values, treatment=df_train['treatment_group_key'].values, y=df_train['conversion'].values)df_res = uplift_model.predict(df_test[x_names].values, full_output=True)print(df_res.shape)df_res.head() y_pred = uplift_model.predict(df_test[x_names].values)# Put the predictions to a DataFrame for a neater presentation# The output of `predict()` is a numpy array with the shape of [n_sample, n_treatment] excluding the# predictions for the control group.result = pd.DataFrame(y_pred, columns=uplift_model.classes_[1:])result.head()# If all deltas are negative, assing to control; otherwise assign to the treatment# with the highest deltabest_treatment = np.where((result <0).all(axis=1),'control', result.idxmax(axis=1))# Create indicator variables for whether a unit happened to have the# recommended treatment or was in the control groupactual_is_best = np.where(df_test['treatment_group_key'] == best_treatment, 1, 0)actual_is_control = np.where(df_test['treatment_group_key'] =='control', 1, 0)synthetic = (actual_is_best ==1) | (actual_is_control ==1)synth = result[synthetic]auuc_metrics = (synth.assign(is_treated =1- actual_is_control[synthetic], conversion = df_test.loc[synthetic, 'conversion'].values, uplift_tree = synth.max(axis=1)) .drop(columns=list(uplift_model.classes_[1:])))plot_gain(auuc_metrics, outcome_col='conversion', treatment_col='is_treated')