We can see that in this objective function, we are allowing only \(\alpha_i\) and \(\beta_t\) to capture the difference between units and time periods. The obvious drawback is that control units that are less similar to a treated unit is given the same weight as those that are more similar. A time period that is far from the beginning of the treatment period is given the same weight as those that are closer. Say the treatment period is 2000, we have observations from 1988 to 2005, then 1988 observations are the same as 1999 observations. This is not ideal. The same logic applies to the units.
It’s a weighted version of DiD, but note carefully that it is not a nesting of it: setting every \(\hat\omega_i^{sc}\) to 1 here does not recover the DiD objective above, because SC has no \(\alpha_i\) term — it would give a pooled regression with time effects only. Dropping the unit fixed effects is a substantive restriction, not a re-weighting. (DiD is nested in synthetic DiD below, which keeps \(\alpha_i\) and sets both weights to be constant; that is the right way to see DiD as a special case.) The weights are set to optimally match donor units to the treated unit so that they are as close as possible at each time point. There is no time weight.
22.3 Synthetic DiD
Arkhangelsky et al (2021) tries to combine the idea of DiD and SC. SC assigns different weights to different control units. The standard DiD is a TWFE, assigning equal weights to all time periods and units.
SDiD sets another weight in addition to SC weights, which changes over time. The SC weights are trying to construct a control unit that is close to the treated unit; the SDiD weights are trying to put more weights on pre-treatment periods that are more similar to post-treatment periods.
22.4 Example from synthdid
The data are the California Proposition 99 panel: annual per-capita cigarette sales in packs for 39 states from 1970 to 2000, with California the single treated unit, 38 donors, 19 pre-treatment years and 12 post-treatment years.
The estimate is \(-15.60\) packs per capita, and the summary shows how it gets there. The unit weights are concentrated — Nevada 0.124, New Hampshire 0.105, Connecticut 0.078 — giving an effective 16.4 donors out of 38. The time weights are more concentrated still: 0.427 on 1988, 0.366 on 1986 and 0.206 on 1987, which is an effective 2.8 pre-periods out of 19. That is the “time-aware” part of synthetic DiD in numbers, and it is the mechanism behind the estimator’s advantage over plain DiD.
Note also that se comes back NA. That is not a glitch: the default is a jackknife standard error, which deletes one treated unit at a time, and California is the only treated unit. The placebo method is the usable option here.
          Diff-in-Diff      Synthetic Control Synthetic Diff-in-Diff
             -27.34911              -19.61966              -15.60383
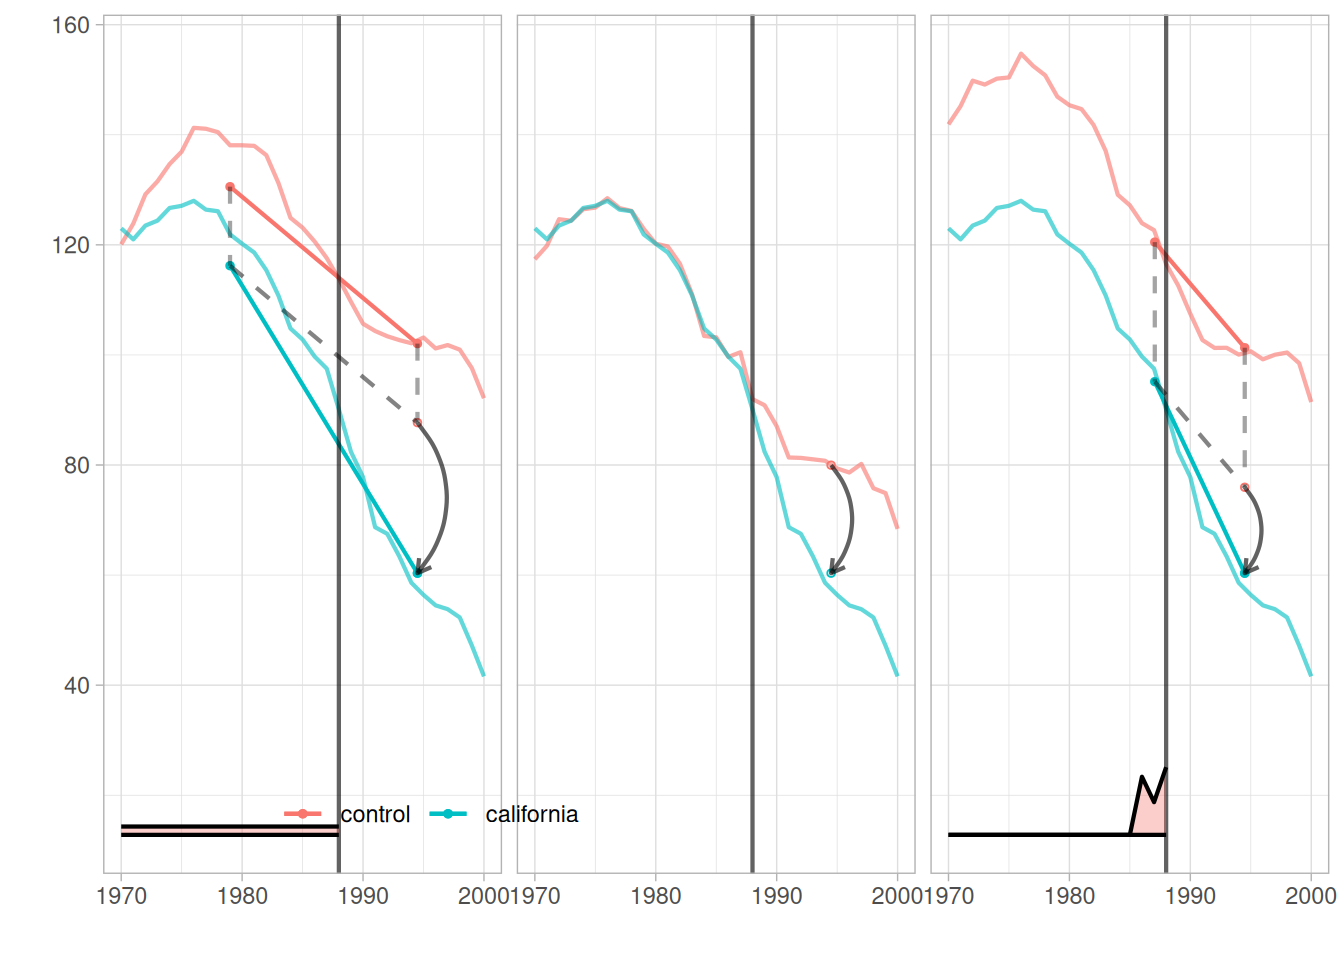
Plain DiD gives \(-27.35\), synthetic control \(-19.62\), and synthetic DiD \(-15.60\). The spread across the three is nearly twelve packs per capita, on the same data. Not, though, on the same identification assumptions: the three differ in what they require of the donor pool and the pre-period, which is part of why they disagree. DiD moves furthest because it weights all 38 donors and all 19 pre-periods equally: states unlike California, and years unlike the late 1980s, all count in full.
Each panel shows California’s path against its weighted control, with the estimated effect as the post-1989 gap. Note: \(\lambda_t\) is plotted at the bottom, so the pre-periods that actually enter each comparison are visible — for synthetic DiD they pile up on 1986–1988, while for DiD the weight is flat across all nineteen years.
22.5 Summary
To me, “DDDiD” is saying DiD is often too simple. That is not the same as saying a weighted estimator dominates. If parallel trends and no anticipation genuinely hold, DiD is identified, and synthetic DiD is not then a strictly better estimator – it buys robustness to a different failure mode, at the price of its own assumptions: a donor pool whose weighted pre-period path tracks the treated unit, and the low-rank or fixed-effects structure that justifies regularized unit and time weights. Nor does a closer pre-treatment fit by itself establish smaller post-treatment bias. The useful reading is that the three estimators lean on different structures, so agreement between them is informative and disagreement tells you which structure is doing the work.
---title: "Causal Panel (why DDDiD)"date: "2025-01-14"---## Why DDDiDGuido Imbens has been saying DDDiD (Don't Do Diff in Diff). But why?To see that, DiD objective function (in the form of TWFE) is:$$ \small (\hat \tau^{did}, \hat \mu, \hat \alpha, \hat \beta) = \underset{\tau, \mu, \alpha, \beta}{argmin} { \Sigma_{i=1}^N \Sigma_{t=1}^T (Y_{it} - \mu - \alpha_i - \beta_t - W_{it} \tau)^2}$$ {#eq-causal-panel-1}We can see that in this objective function, we are allowing only $\alpha_i$ and $\beta_t$ to capture the difference between units and time periods. The obvious drawback is that control units that are less similar to a treated unit is given the same weight as those that are more similar. A time period that is far from the beginning of the treatment period is given the same weight as those that are closer. Say the treatment period is 2000, we have observations from 1988 to 2005, then 1988 observations are the same as 1999 observations. This is not ideal. The same logic applies to the units.## Synthetic ControlSC objective function: $$ (\hat \tau^{sc}, \hat \mu, \hat \beta) = \underset{\tau, \mu, \beta}{argmin} { \Sigma_{i=1}^N \Sigma_{t=1}^T (Y_{it} - \mu - \beta_t - W_{it} \tau)^2 \hat \omega_i^{sc}}$$ {#eq-causal-panel-2}It's a weighted version of DiD, but note carefully that it is **not** a nesting of it: setting every $\hat\omega_i^{sc}$ to 1 here does not recover the DiD objective above, because SC has no $\alpha_i$ term --- it would give a pooled regression with time effects only. Dropping the unit fixed effects is a substantive restriction, not a re-weighting. (DiD *is* nested in synthetic DiD below, which keeps $\alpha_i$ and sets both weights to be constant; that is the right way to see DiD as a special case.) The weights are set to optimally match donor units to the treated unit so that they are as close as possible at each time point. There is no time weight.## Synthetic DiDArkhangelsky et al (2021) tries to combine the idea of DiD and SC. SC assigns different weights to different control units. The standard DiD is a TWFE, assigning equal weights to all time periods and units.$$ \small (\hat \tau^{sdid}, \hat \mu, \hat \alpha, \hat \beta) = \underset{\tau, \mu, \alpha, \beta}{argmin} { \Sigma_{i=1}^N \Sigma_{t=1}^T \hat \omega_i^{sdid} \lambda_t^{sdid} (Y_{it} - \mu - \alpha_i - \beta_t - W_{it} \tau)^2}$$ {#eq-causal-panel-3}SDiD sets another weight in addition to SC weights, which changes over time. The SC weights are trying to construct a control unit that is close to the treated unit; the SDiD weights are trying to put more weights on pre-treatment periods that are more similar to post-treatment periods.## Example from synthdidThe data are the California Proposition 99 panel: annual per-capita cigarettesales in packs for 39 states from 1970 to 2000, with California the singletreated unit, 38 donors, 19 pre-treatment years and 12 post-treatment years.```{r}#| label: did13#| include: true#| warning: false#| cache: true#| message: false#| echo: truelibrary(synthdid)data('california_prop99')setup =panel.matrices(california_prop99)tau.hat =synthdid_estimate(setup$Y, setup$N0, setup$T0)summary(tau.hat)```The estimate is $-15.60$ packs per capita, and the summary shows how it getsthere. The unit weights are concentrated — Nevada 0.124, New Hampshire 0.105,Connecticut 0.078 — giving an effective 16.4 donors out of 38. The time weightsare more concentrated still: 0.427 on 1988, 0.366 on 1986 and 0.206 on 1987,which is an effective 2.8 pre-periods out of 19. That is the "time-aware" part ofsynthetic DiD in numbers, and it is the mechanism behind the estimator'sadvantage over plain DiD.Note also that `se` comes back `NA`. That is not a glitch: the default is ajackknife standard error, which deletes one treated unit at a time, andCalifornia is the only treated unit. The placebo method is the usable optionhere.```{r}#| label: did15#| include: true#| warning: false#| cache: true#| message: false#| echo: truetau.sc =sc_estimate(setup$Y, setup$N0, setup$T0)tau.did =did_estimate(setup$Y, setup$N0, setup$T0)estimates =list(tau.did, tau.sc, tau.hat)names(estimates) =c('Diff-in-Diff', 'Synthetic Control', 'Synthetic Diff-in-Diff')print(unlist(estimates))```Plain DiD gives $-27.35$, synthetic control $-19.62$, and synthetic DiD$-15.60$. The spread across the three is nearly twelve packs per capita, on thesame data. Not, though, on the same identification assumptions: the three differin what they require of the donor pool and the pre-period, which is part of whythey disagree. DiD moves furthest because itweights all 38 donors and all 19 pre-periods equally: states unlike California,and years unlike the late 1980s, all count in full.```{r}#| label: did16#| include: true#| warning: false#| cache: true#| message: false#| echo: trueplot <-synthdid_plot(estimates, facet.vertical=FALSE,control.name='control', treated.name='california',lambda.comparable=TRUE, se.method ='none',trajectory.linetype =1, line.width=.75, effect.curvature=-.4,trajectory.alpha=.7, effect.alpha=.7,diagram.alpha=1, onset.alpha=.7) +theme(legend.position=c(.26,.07), legend.direction='horizontal',legend.key=element_blank(), legend.background=element_blank(),strip.background=element_blank(), strip.text.x =element_blank())plot```Each panel shows California's path against its weighted control, with theestimated effect as the post-1989 gap. Note: $\lambda_t$ is plotted at thebottom, so the pre-periods that actually enter each comparison are visible —for synthetic DiD they pile up on 1986–1988, while for DiD the weight is flatacross all nineteen years.## SummaryTo me, "DDDiD" is saying DiD is often too simple. That is not the same as saying a weighted estimator dominates. If parallel trends and no anticipation genuinely hold, DiD is identified, and synthetic DiD is not then a strictly better estimator -- it buys robustness to a different failure mode, at the price of its own assumptions: a donor pool whose weighted pre-period path tracks the treated unit, and the low-rank or fixed-effects structure that justifies regularized unit and time weights. Nor does a closer pre-treatment fit by itself establish smaller post-treatment bias. The useful reading is that the three estimators lean on different structures, so agreement between them is informative and disagreement tells you which structure is doing the work.---<!-- see-also-footer -->*Systematic treatment: [R](https://xiangao.github.io/causal_econometrics_guide/g-methods.html) · [Julia](https://xiangao.github.io/causal_econometrics_julia/g-methods.html).*