18 Causal Mediation Analysis
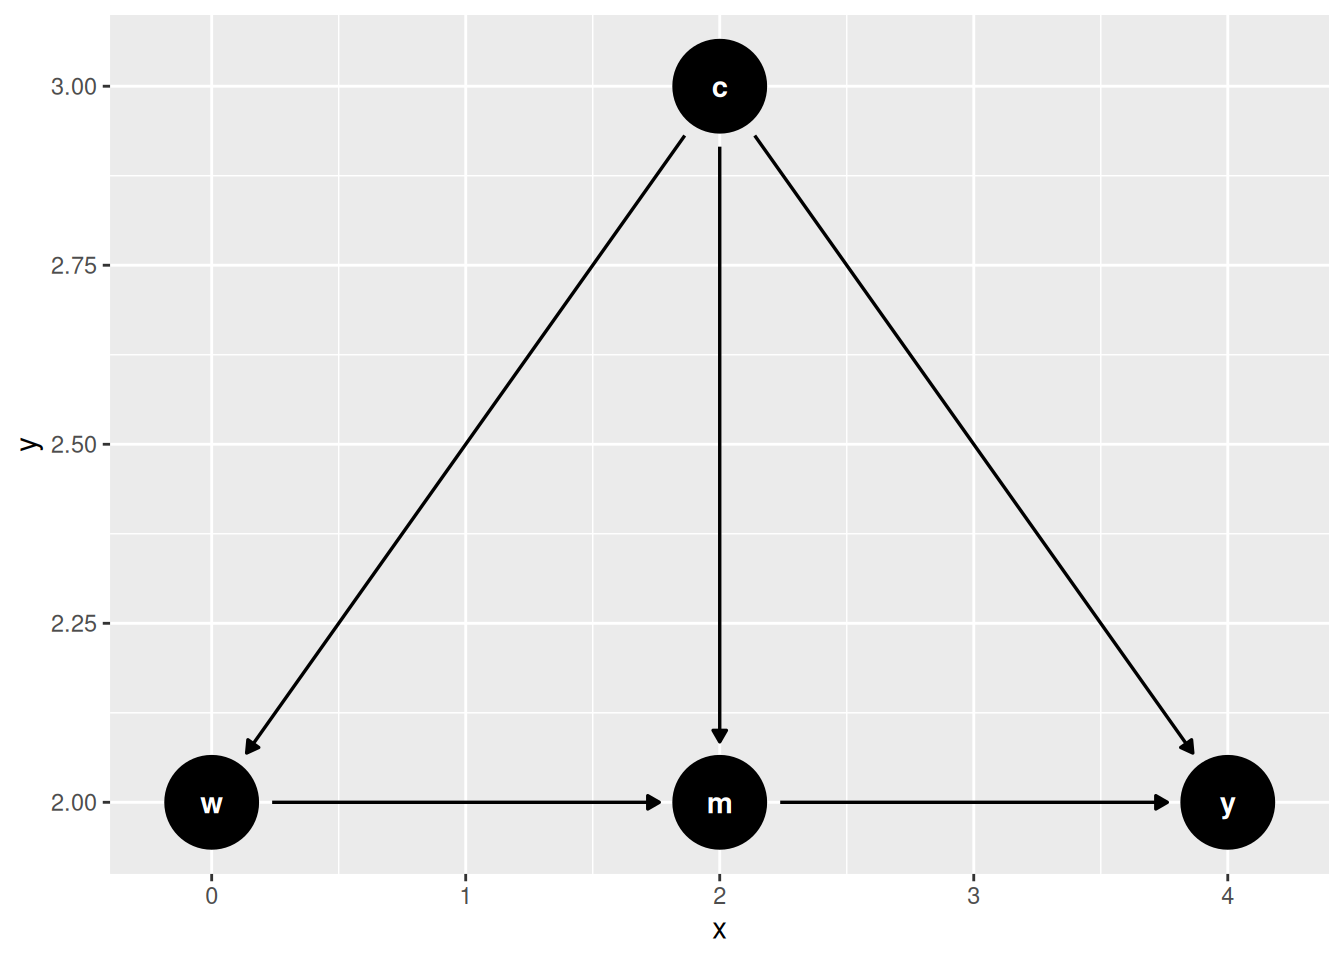
Mediation asks how a treatment works, not only whether it works. The graph below is the setting: \(w\) is the treatment, \(m\) a mediator that \(w\) affects and that in turn affects the outcome \(y\), and \(c\) a set of covariates confounding both the \(w \to y\) and the \(m \to y\) relationships. The effect of \(w\) on \(y\) splits into a path through \(m\) and a path around it.
18.1 Classical Mediation
Traditionally mediation model can be represented in the following equations:
\[ Y = a W + b M + \epsilon_1 \tag{18.1}\] \[ M = c W + \epsilon_2 \tag{18.2}\]
That is, we’d like to study the effect of \(W\) on \(Y\), and we see the effect can be a direct effect, and an indirect effect, through \(M\).
Baron and Kenny’s (http://davidakenny.net/cm/mediate.htm) method is done in four steps. Modern approach tends to use SEM (structural equation modeling) to model these two equations directly.
We simulate \(n = 10{,}000\) observations from exactly this structure: \(X \sim N(0,1)\), \(M = 0.5X + \varepsilon_2\), and \(Y = 0.7M + 0.3X + \varepsilon_1\), with both errors standard normal. So the true direct effect is \(a = 0.3\), the mediator coefficient is \(b = 0.7\), the treatment-to-mediator coefficient is \(c = 0.5\), the indirect effect is \(bc = 0.35\), and the total effect is \(0.3 + 0.35 = 0.65\). There is no confounding of any kind, which is what makes this the easy case.
lavaan 0.6-21 ended normally after 1 iteration

  Estimator                                         ML
  Optimization method                           NLMINB
  Number of model parameters                         5

  Number of observations                         10000

Model Test User Model:

  Test statistic                                 0.000
  Degrees of freedom                                 0

Parameter Estimates:

  Standard errors                             Standard
  Information                                 Expected
  Information saturated (h1) model          Structured

Regressions:
                   Estimate  Std.Err  z-value  P(>|z|)
  Y ~
    X          (a)    0.286    0.011   25.233    0.000
    M          (b)    0.699    0.010   70.384    0.000
  M ~
    X          (c)    0.511    0.010   50.161    0.000

Variances:
                   Estimate  Std.Err  z-value  P(>|z|)
   .Y                 0.998    0.014   70.711    0.000
   .M                 1.012    0.014   70.711    0.000

Defined Parameters:
                   Estimate  Std.Err  z-value  P(>|z|)
    bc                0.357    0.009   40.849    0.000
    total             0.643    0.012   51.956    0.000
The estimates are \(a = 0.286\), \(b = 0.699\) and \(c = 0.511\), against true values of 0.3, 0.7 and 0.5. The derived quantities are \(bc = 0.357\) against a true 0.35 and a total of 0.643 against 0.65. Everything is recovered, and the model test statistic is 0 on 0 degrees of freedom because the model is saturated — it has as many parameters as moments, so it cannot fail to fit and the fit statistic carries no information.
18.1.1 Problems with Classical Mediation
- Lack of causal claim. We have to assume that there is no unmeasured confounder between \(M\) and \(Y\). This is a strong assumption.
- Assumption of homogeneous effect.
18.2 Causal Mediation
18.2.1 CDE
Suppose we can set \(W\) and \(M\) at will to any \((w, m)\), then we have the potential outcome \(Y(w,m)\).
Controlled direct effect (CDE) is defined as \[ CDE(m) = E[Y(1,m)-Y(0,m)] \tag{18.3}\] That is, setting \(M\) to \(m\), what is the effect of \(W\) on \(Y\)?
18.2.2 Assumptions
- Conditional treatment randomization. Suppose we observe confounders X, which can be a joint set of confounders for the W to Y pathway, or the M to Y pathway.
\[ Y(w,m) \perp W|X \tag{18.4}\]
This is the usual conditional independence (unconfoundedness, ignorability, etc.) assumption. This is saying the assignment of treatment, given covariates \(X\), has nothing to do with potential outcomes.
- Conditional mediator randomization.
\[ Y(w,m) \perp M|X, W=w \tag{18.5}\]
This is to say, within each strata of X, given treatment status, the assignment of mediator gives no information about potential outcome. This randomization is usually not implemented during many experiments (random trials). This is the assumption that makes a lot of mediation hard to make a causal claim.
- Positivity (overlap). There are two positivity assumptions:
\[ P(W=w | X=x) > 0 \tag{18.6}\] for all \(x\). This is the usual positivity assumption.
\[ P(M=m | X=x, W=w) > 0 \tag{18.7}\] for all \(x\), \(w\), and \(m\). This is the mediator positivity.
18.2.3 Estimation
CDE can be estimated using G-computation method, or IPW, or the doubly-robust methods, one of them is AIPW (augmented IPW).
18.2.4 G-computation
G-computation is to model the outcome equation: \[ \begin{aligned} CDE_G(m) &= \sum_x [ E[Y \mid W=1, M=m, X=x] \\ &\quad - E[Y \mid W=0, M=m, X=x]]\, P(X=x) \end{aligned} \tag{18.8}\]
18.2.5 IPW
IPW is to model the treatment assignment equation and the mediator assignment equation. The joint denominator factorizes sequentially – treatment given covariates, then mediator given treatment and covariates – which is the structure the estimator below relies on:
\[ \small E[Y(w,m)] = E\!\left[{\frac{I(W=w)\,I(M=m)}{g_W(w|X)\,g_M(m|w,X)}}\, Y\right] \tag{18.9}\]
Therefore,
\[ \small CDE_{ipw}(m) = E\left[\frac{I(W=1,M=m)}{g_M(m|1,X)\,g_W(1|X)}\, Y - \frac{I(W=0,M=m)}{g_M(m|0,X)\,g_W(0|X)}\, Y\right] \tag{18.10}\]
where \(g_M\) is the probability of the mediator and \(g_W\) the probability of treatment. This indicator-based form is for a discrete (here binary) mediator. For a continuous mediator the indicator \(I(M=m)\) and the probability \(g_M\) must be replaced by a conditional density (or a kernel/stochastic-intervention formulation); the estimator above does not apply as written.
18.2.6 AIPW
\[ CDE_{AIPW} = CDE_G(m) + B(\bar Q, g_M, g_W) \tag{18.11}\] where \(\bar Q\) is the mean outcome function.
\[ \begin{aligned} B(\bar Q, g_M, g_W) &= \frac{1}{n} \sum_{i=1}^{n} {\frac{I(M_i=m, W_i=1)}{g_M(m|1, X_i) g_W(1|X_i)}[Y_i-\bar Q(m,1,X_i)]} \\ &\quad - \frac{1}{n} \sum_{i=1}^{n} {\frac{I(M_i=m, W_i=0)}{g_M(m|0, X_i) g_W(0|X_i)}[Y_i-\bar Q(m,0,X_i)]} \end{aligned} \tag{18.12}\]
18.2.7 Example: G-computation
The three estimators below run on one simulated data set of \(n = 5000\). There are two independent standard normal covariates, \(W_1\) confounding the treatment-outcome relationship and \(W_2\) confounding the mediator-outcome relationship. Treatment is \(A \sim \text{Bernoulli}(\Lambda(-1 + W_1/2))\), the mediator is \(M \sim \text{Bernoulli}(\Lambda(-2 + A/2 + W_2/3))\), and the outcome is \(Y \sim \text{Bernoulli}(\Lambda(-1 + A - M/2 + W_1/3 + W_2/3))\). All three are binary.
The target is \(CDE(0)\), the effect of treatment with the mediator held at 0 for everyone. Since the DGP is fully specified we can integrate it out: \(CDE(0) = E_W[\Lambda(W_1/3 + W_2/3) - \Lambda(-1 + W_1/3 + W_2/3)] = 0.222\). For comparison, \(CDE(1) = 0.191\) — the effect is smaller when the mediator is held at 1, because the logistic link is flatter away from its centre.
Code
set.seed(1234)
n <- 5000
# confounder of A/Y
W1 <- rnorm(n)
# confounder of M/Y
W2 <- rnorm(n)
# treatment
A <- rbinom(n, 1, plogis(-1 + W1 / 2))
# binary mediator
M <- rbinom(n, 1, plogis(-2 + A / 2 + W2 / 3))
# binary outcome
Y <- rbinom(n, 1, plogis(-1 + A - M / 2 + W1 / 3 + W2 / 3))
full_data <- data.frame(W1 = W1, W2 = W2, A = A, M = M, Y = Y)

# fit outcome regression
or_fit <- glm(Y ~ A + M + W1 + W2, family = binomial(), data = full_data)
# new data setting A and M
data_A1_M0 <- data_A0_M0 <- full_data
data_A1_M0$A <- 1; data_A1_M0$M <- 0
data_A0_M0$A <- 0; data_A0_M0$M <- 0
# predict on new data
Qbar_A1_M0 <- predict(or_fit, newdata = data_A1_M0, type = "response")
Qbar_A0_M0 <- predict(or_fit, newdata = data_A0_M0, type = "response")
# gcomp estimate of CDE(0)
mean(Qbar_A1_M0 - Qbar_A0_M0)
[1] 0.2515527G-computation gives 0.2516.
18.2.8 Example: IPW
The same target through the treatment and mediator models instead of the outcome model.
Code
# model for P(A = 1 | W)
ps_fit1 <- glm(A ~ W1 + W2, family = binomial(), data = full_data)
P_A1_W <- predict(ps_fit1, type = "response")
P_A0_W <- 1 - P_A1_W
# model for P(M = 0 | A, W)
ps_fit2 <- glm(M ~ A + W1 + W2, family = binomial(), data = full_data)
# P(M = 0 | A = 1, W)
data_A1 <- full_data; data_A1$A <- 1
P_M0_A1_W <- 1 - predict(ps_fit2, newdata = data_A1, type = "response")
# P(M = 0 | A = 0, W)
data_A0 <- full_data; data_A0$A <- 0
P_M0_A0_W <- 1 - predict(ps_fit2, newdata = data_A0, type = "response")
# ipw estimate of CDE(0)
mean( (A == 1) / P_A1_W * (M == 0) / P_M0_A1_W * Y ) -
mean( (A == 0) / P_A0_W * (M == 0) / P_M0_A0_W * Y )
[1] 0.2553091IPW gives 0.2553.
18.2.9 Example: AIPW
Combining both, so that either the outcome model or the two treatment models may be wrong.
Code
# aipw estimate of E[Y(1,0)]
aiptw_EY_A1_M0 <- mean(Qbar_A1_M0) +
mean( (A == 1) / P_A1_W * (M == 0) / P_M0_A1_W * (Y - Qbar_A1_M0) )
# aipw estimate of E[Y(0,0)]
aiptw_EY_A0_M0 <- mean(Qbar_A0_M0) +
mean( (A == 0) / P_A0_W * (M == 0) / P_M0_A0_W * (Y - Qbar_A0_M0) )
# aipw estimate of CDE(0)
aiptw_EY_A1_M0 - aiptw_EY_A0_M0
[1] 0.2554265AIPW gives 0.2554.
The three estimates are 0.2516, 0.2553 and 0.2554 against a true \(CDE(0)\) of 0.222. They agree closely with each other and all sit about 0.03 above the truth. That is one draw being unlucky, not bias: every model here is correctly specified, and over 400 replications of this design the g-computation estimator averages 0.2206 with a sampling standard deviation of 0.0159, so this seed’s 0.2516 is 1.9 standard deviations high. The three estimators agree with each other much more closely than any of them agrees with the truth, because they share the same data and the same fitted nuisance models — agreement across estimators is a check on implementation, not on sampling error.
18.3 NIE and NDE: Natural Direct and Indirect Effects
CDE is to study the effect of treatment, given the level of mediator. Instead, Natural Effect is to set mediator to its natural value with the value of treatment, that is, \(M=M(w)\).
\[ \begin{aligned} ATE &= NIE + NDE \\ &= (E[Y(1,M(1))] - E[Y(1,M(0))]) \\ &\quad + (E[Y(1, M(0))] - E[Y(0,M(0))]) \end{aligned} \tag{18.13}\]
The advantage of NDE and NIE comparing to CDE is that it’s more “natural”; that is, you don’t set the level of mediator deterministically. And it can decompose the ATE into direct and indirect effects.
However, there is an additional assumption needed to identify NDE and NIE.
18.3.1 Additional Assumption
\[ Y(w, m) \perp M(w^*) | X \tag{18.14}\]
This is the “cross-world” condition: the outcome under \((w,m)\) is independent of \(M\) under \(w^*\). These two situations cannot happen in the same world; you cannot set \(W\) to both \(w\) and \(w^*\). No experiment can implement it.
This cross-world independence is additional to, not a replacement for, the usual identifying assumptions. The standard mediation formula for natural effects also requires:
- treatment ignorability (no unmeasured treatment-outcome confounding) given \(X\);
- mediator ignorability (no unmeasured mediator-outcome confounding) given \(W\) and \(X\);
- positivity for both the treatment and the mediator; and
- no treatment-induced confounding of the mediator-outcome relationship – there must be no variable affected by \(W\) that confounds \(M\) and \(Y\). (When such a confounder exists, natural effects are not identified by this formula and interventional direct/indirect effects are used instead.)
The cross-world condition by itself is not sufficient.
18.3.2 Estimation
We use the same simulated data. The outcome model now adds \(A \times M\) and \(M \times W_1\) interactions and the mediator model adds \(A \times W_1\) and \(W_1 \times W_2\) — both are richer than the DGP requires, which costs a little precision and no consistency. We then average \(E[Y \mid A=a, M, W]\) over the distribution of \(M\) under \(A = a'\), for each of the four \((a, a')\) combinations.
The truths again follow from the DGP by integration: \(E[Y(1,M(1))] = 0.478\), \(E[Y(1,M(0))] = 0.486\) and \(E[Y(0,M(0))] = 0.267\), so the true \(NDE = 0.218\), \(NIE = -0.008\) and \(ATE = 0.211\). The indirect effect is slightly negative because treatment raises the chance of the mediator (from 0.124 to 0.188) while the mediator lowers the outcome — the \(-M/2\) term. So this treatment helps directly and hurts a little through its mediator.
Code
# fit outcome regression (include interaction because we can)
or_fit <- glm(Y ~ A + M + W1 + W2 + A*M + M*W1,
family = binomial(), data = full_data)
# need E(Y | A = 0/1, M = 0/1, W1 = W1i, W2 = W2i)
get_EY_a_m_Wi <- function(full_data, or_fit, a, m){
data_Aa_Mm_Wi <- full_data
data_Aa_Mm_Wi$A <- a; data_Aa_Mm_Wi$M <- m
predict(or_fit, newdata = data_Aa_Mm_Wi, type = "response")
}
EY_A0_M0_Wi <- get_EY_a_m_Wi(full_data, or_fit, a = 0, m = 0)
EY_A0_M1_Wi <- get_EY_a_m_Wi(full_data, or_fit, a = 0, m = 1)
EY_A1_M0_Wi <- get_EY_a_m_Wi(full_data, or_fit, a = 1, m = 0)
EY_A1_M1_Wi <- get_EY_a_m_Wi(full_data, or_fit, a = 1, m = 1)

# include interactions -- why not?
med_fit <- glm(M ~ A*W1 + W1*W2, family = binomial(), data = full_data)
# estimates of P(M = m | A = a, W = W_i)
get_Pm_a_Wi <- function(full_data, med_fit, a, m){
data_Aa_Wi <- full_data; data_Aa_Wi$A <- a
p <- predict(med_fit, newdata = data_Aa_Wi, type = "response")
if(m == 1){
p
}else{
1 - p
}
}
PM0_A0_Wi <- get_Pm_a_Wi(full_data, med_fit, a = 0, m = 0)
PM1_A0_Wi <- get_Pm_a_Wi(full_data, med_fit, a = 0, m = 1)
PM0_A1_Wi <- get_Pm_a_Wi(full_data, med_fit, a = 1, m = 0)
PM1_A1_Wi <- get_Pm_a_Wi(full_data, med_fit, a = 1, m = 1)

# E(E(Y | A = 1, M, W) | A = 1, W)
EY1M1_Wi <- EY_A1_M1_Wi * PM1_A1_Wi + EY_A1_M0_Wi * PM0_A1_Wi
# E(E(Y | A = 0, M, W) | A = 1, W)
EY0M1_Wi <- EY_A0_M1_Wi * PM1_A1_Wi + EY_A0_M0_Wi * PM0_A1_Wi
# E(E(Y | A = 1, M, W) | A = 0, W)
EY1M0_Wi <- EY_A1_M1_Wi * PM1_A0_Wi + EY_A1_M0_Wi * PM0_A0_Wi
# E(E(Y | A = 0, M, W) | A = 0, W)
EY0M0_Wi <- EY_A0_M1_Wi * PM1_A0_Wi + EY_A0_M0_Wi * PM0_A0_Wi

# estimate of E[Y(1, M(1))]
E_Y1M1 <- mean(EY1M1_Wi)
# estimate of E[Y(0, M(1))]
E_Y0M1 <- mean(EY0M1_Wi)
# estimate of E[Y(1, M(0))]
E_Y1M0 <- mean(EY1M0_Wi)
# estimate of E[Y(0, M(0))]
E_Y0M0 <- mean(EY0M0_Wi)

# Decomposition: ATE = NIE + NDE
NIE <- E_Y1M1 - E_Y1M0   # natural indirect effect
NDE <- E_Y1M0 - E_Y0M0   # natural direct effect
ATE <- E_Y1M1 - E_Y0M0   # total effect
cat(sprintf("NDE = %.3f\nNIE = %.3f\nATE = NDE + NIE = %.3f\n", NDE, NIE, ATE))
NDE = 0.247
NIE = -0.010
ATE = NDE + NIE = 0.238The estimates are \(NDE = 0.247\), \(NIE = -0.010\) and \(ATE = 0.238\), against truths of 0.218, \(-0.008\) and 0.211. The decomposition holds exactly by construction, \(0.247 + (-0.010) = 0.238\), and the sign of the indirect effect is recovered. The same upward shift as in the CDE estimates appears here, for the same reason: it is one draw of the data, and every quantity in this section is computed from it.
Note how much smaller the indirect effect is than the direct one, \(-0.010\) against 0.247. Reporting only the total effect of 0.238 would hide that the mediator works against the treatment.
18.4 IIE and IDE: Interventional Direct and Indirect Effects
People are not happy with the cross-world assumption in general. Interventional direct and indirect effects avoid it. The device is a random draw: let \(M^*_w\) denote a draw from the distribution of \(M(w)\) given \(X=x\), rather than the unit’s own \(M(w)\). The standard definitions (Vansteelandt and Daniel 2017; Díaz et al. 2021) use such a draw in every term:
\[ \begin{aligned} IDE &= E[Y(1,M^*_0)] - E[Y(0,M^*_0)] \\ IIE &= E[Y(1,M^*_1)] - E[Y(1,M^*_0)] \end{aligned} \tag{18.15}\]
The direct effect holds the mediator draw fixed at its untreated distribution; the indirect effect moves only that distribution. The two add up to
\[ IDE + IIE = E[Y(1,M^*_1)] - E[Y(0,M^*_0)], \tag{18.16}\]
the overall interventional effect. It need not equal the \(ATE\): replacing the unit’s own \(M(w)\) by a random draw breaks the within-unit dependence between \(M(w)\) and \(Y(w,\cdot)\), and that dependence matters exactly when a treatment-induced confounder \(Z\) sits between the treatment and the mediator — the situation in the example below. The payoff is identification without the cross-world assumption, even in the presence of such a \(Z\). These interventional effects are the estimands the medoutcon package implements.
18.4.1 Example
This example uses the medoutcon vignette’s own DGP, which is built to contain exactly the treatment-induced confounder that defeats natural effects. We draw \(n = 1000\) observations. Three binary baseline covariates: \(W_1 \sim \text{Bernoulli}(0.6)\), \(W_2 \sim \text{Bernoulli}(0.3)\), and \(W_3 \sim \text{Bernoulli}(\min(0.2 + (W_1+W_2)/3,\, 1))\). Treatment is \(A \sim \text{Bernoulli}(\Lambda(\sum_j W_j - 2))\).
Then the key variable: \(Z \sim \text{Bernoulli}(\Lambda(\overline{-\log 2 + W - A} + 0.2))\) is a mediator-outcome confounder that depends on \(A\). The mediator is \(M \sim \text{Bernoulli}(\Lambda(\log 3 (W_1 + W_2) + A - Z))\) and the outcome is \(Y \sim \text{Bernoulli}(\Lambda(1/(\sum_j W_j - Z + A + M)))\).
Because \(Z\) is affected by \(A\) and confounds \(M\) and \(Y\), natural direct and indirect effects are not identified here by the formula of the previous section. Interventional effects are, which is the reason for this example. We do not have a closed-form truth for this DGP — the reciprocal inside the outcome link makes it awkward — so read the estimates against each other and against zero rather than against a target.
Code
library(data.table)
library(tidyverse)
library(medoutcon)
set.seed(1584)

# produces a simple data set based on ca causal model with mediation
make_example_data <- function(n_obs = 1000) {
  ## baseline covariates
  w_1 <- rbinom(n_obs, 1, prob = 0.6)
  w_2 <- rbinom(n_obs, 1, prob = 0.3)
  w_3 <- rbinom(n_obs, 1, prob = pmin(0.2 + (w_1 + w_2) / 3, 1))
  w <- cbind(w_1, w_2, w_3)
  w_names <- paste("W", seq_len(ncol(w)), sep = "_")

  ## exposure
  a <- as.numeric(rbinom(n_obs, 1, plogis(rowSums(w) - 2)))

  ## mediator-outcome confounder affected by treatment
  z <- rbinom(n_obs, 1, plogis(rowMeans(-log(2) + w - a) + 0.2))

  ## mediator -- could be multivariate
  m <- rbinom(n_obs, 1, plogis(rowSums(log(3) * w[, -3] + a - z)))
  m_names <- "M"

  ## outcome
  ## (the reciprocal inside plogis is an idiosyncrasy of the medoutcon
  ##  vignette DGP, not a standard logistic model; a zero denominator
  ##  gives plogis(Inf) = 1, which R handles without error)
  y <- rbinom(n_obs, 1, plogis(1 / (rowSums(w) - z + a + m)))

  ## construct output
  dat <- as.data.table(cbind(w = w, a = a, z = z, m = m, y = y))
  setnames(dat, c(w_names, "A", "Z", m_names, "Y"))
  return(dat)
}
Code
# set seed and simulate example data
example_data <- make_example_data()
w_names <- str_subset(colnames(example_data), "W")
m_names <- str_subset(colnames(example_data), "M")

# quick look at the data
head(example_data)
W_1 W_2 W_3 A Z M Y
<num> <num> <num> <num> <num> <num> <num>
1: 1 0 1 0 0 0 1
2: 0 1 0 0 0 1 0
3: 1 1 1 1 0 1 1
4: 0 1 1 0 0 1 0
5: 0 0 0 0 0 1 1
6: 1 0 1 1 0 1 0Code
# A tibble: 1 × 7
  lwr_ci param_est upr_ci var_est eif_mean estimator param
   <dbl>     <dbl>  <dbl>   <dbl>    <dbl> <chr>     <chr>
1 -0.170   -0.0708 0.0281 0.00254 1.12e-16 onestep   direct_interventional
The one-step estimator gives an interventional direct effect of \(-0.071\) with a 95% interval of \([-0.170, 0.028]\). The interval includes zero.
The same estimand can be targeted by TMLE instead:
Code
# A tibble: 1 × 7
  lwr_ci param_est upr_ci var_est eif_mean estimator param
   <dbl>     <dbl>  <dbl>   <dbl>    <dbl> <chr>     <chr>
1 -0.169   -0.0679 0.0332 0.00266   0.0210 tmle      direct_interventional
TMLE gives \(-0.068\) with a 95% interval of \([-0.169, 0.033]\), essentially the same answer as the one-step estimator. Both are indistinguishable from zero at \(n = 1000\): the interval is about 0.2 wide for an effect of 0.07, so this sample cannot resolve it.
One diagnostic in the output is worth reading. The eif_mean column reports the mean of the estimated efficient influence function, which should be zero at the solution. The one-step estimator gives \(1.1 \times 10^{-16}\), machine zero, as it must — solving that equation is what a one-step estimator does. TMLE gives 0.021, which is not zero. TMLE reaches its solution by tilting the initial outcome fit rather than by adding a correction term, and here the tilt has not driven the score all the way to zero. The two estimates agree anyway, but a large eif_mean is the signal that a TMLE fit has not converged. The TMLE chapter in Topics on Econometrics and Causal Inference works through the tilting step and its convergence diagnostics in detail.